
One of the strategic directions in the era of digital transformation is the use of data and analytics to empower employees. Increasing amount and role of data and IT technology as component of products of any company [for example cars becoming connected or on-line retail constantly gaining in importance], and fundamental shift internet has played in engaging and providing voice to our customers through channels like Facebook, Linked-in and Twitter requires that to be successful companies need to invest in the data related skills of employees. As our workforce becomes more digitally native, aware and accepting increasing amount of real time metrics and machine learning models as components of digitally enabled products and business processes HR function will need to transform as well.
At the same time data powered, intelligent agents and robots will shift the composition of the workforce and HR leaders over the next 10 years will need to manage transition where up to 40% of traditional jobs will be replaced by the algorithms. ‘The automation of factories has already decimated jobs in traditional manufacturing, and the rise of artificial intelligence is likely to extend this job destruction deep into the middle classes, with only the most caring, creative or supervisory roles remaining.’ – Stephen Hawking . Managing these transition will require new skills form HR leaders, who will need to better understand where intelligent agents can help humans, and where they could replace them. In the world where human beings are not the only workforce of the future HR leaders will need to develop skills to understand the peculiarities of hiring “virtual agents” and develop much closer partnership with IT, Data and Analytics functions to manage this transformation and drive human – AI symbiosis. Examples of such projects include Foxconn: A key manufacturing partner for Apple, Google and Amazon, is the world’s 10th largest employer and it has already replaced 60,000 workers with robots, according to a recent note written in part by analyst John Seagrim at CLSA. Walmart anouncing plans to replace its warehouse stock-checkers with flying drones that can scan miles of shelves in a fraction of the time or the US Department of Defence: The No.1 global employer, is already flying the world’s largest fleet of unmanned aerial vehicles – drones, basically – in its various Middle East conflicts.
So how HR leaders could start preparing for this change?
I would claim that the best way to prepare yourself and your organization for this world is to embrace and organize data in your own HR function and start experimenting with real time metrics and machine learning models in HR domain. Leading organizations long ago started to shift their HR processes to digital platforms, first to gain efficiency in areas of hard HR, and recently also to enable and modernize soft/business HR processes like capturing 360 feedback or employee performance management.
Many of the HR processes start to be increasingly measurable and produce data that could bring transparency and improve HR management in your company. They could also enable HR leader to promptly respond to all kinds of questions on the effectiveness of recruiting onboarding or training growing respect and value of the function. Most importantly however metrics and data have an immense power to drive improvement, and when well-designed can raise effectiveness of HR function. The key challenge that most HR leaders and organizations struggle with is that systems are not interconnected, metrics are often not well defined and HR leader needs to go to many different tools to access the data. So, even if we have more data than we ever had, often HR organizations are run purely based on instincts, since pulling the data from the systems, analyzing and ensuring their quality is hard.
Recent advent of easy data visualization tools like Power BI can quickly turn this around. It has an ability of pulling data from many company systems that run HR and business processes and organizing it on a dashboard for the HR executive and his HR business partner team.
When data is in one place, effectively visualized the HR team can start running the function based on these data and provide factual answers at any moment and at any given level of aggregation. For example: how many days on average does it take to recruit an employee, and how does it differ between sales and production? Or how many contracts do we need to sign per month or which benefits have largest influence on employee satisfaction? Once data is watched this way a lot of new possibilities open in HR analytics to answer even more complex questions like correlation of benefit participation, impact on employee satisfaction and its costs, or how many people are likely to leave the company next month?
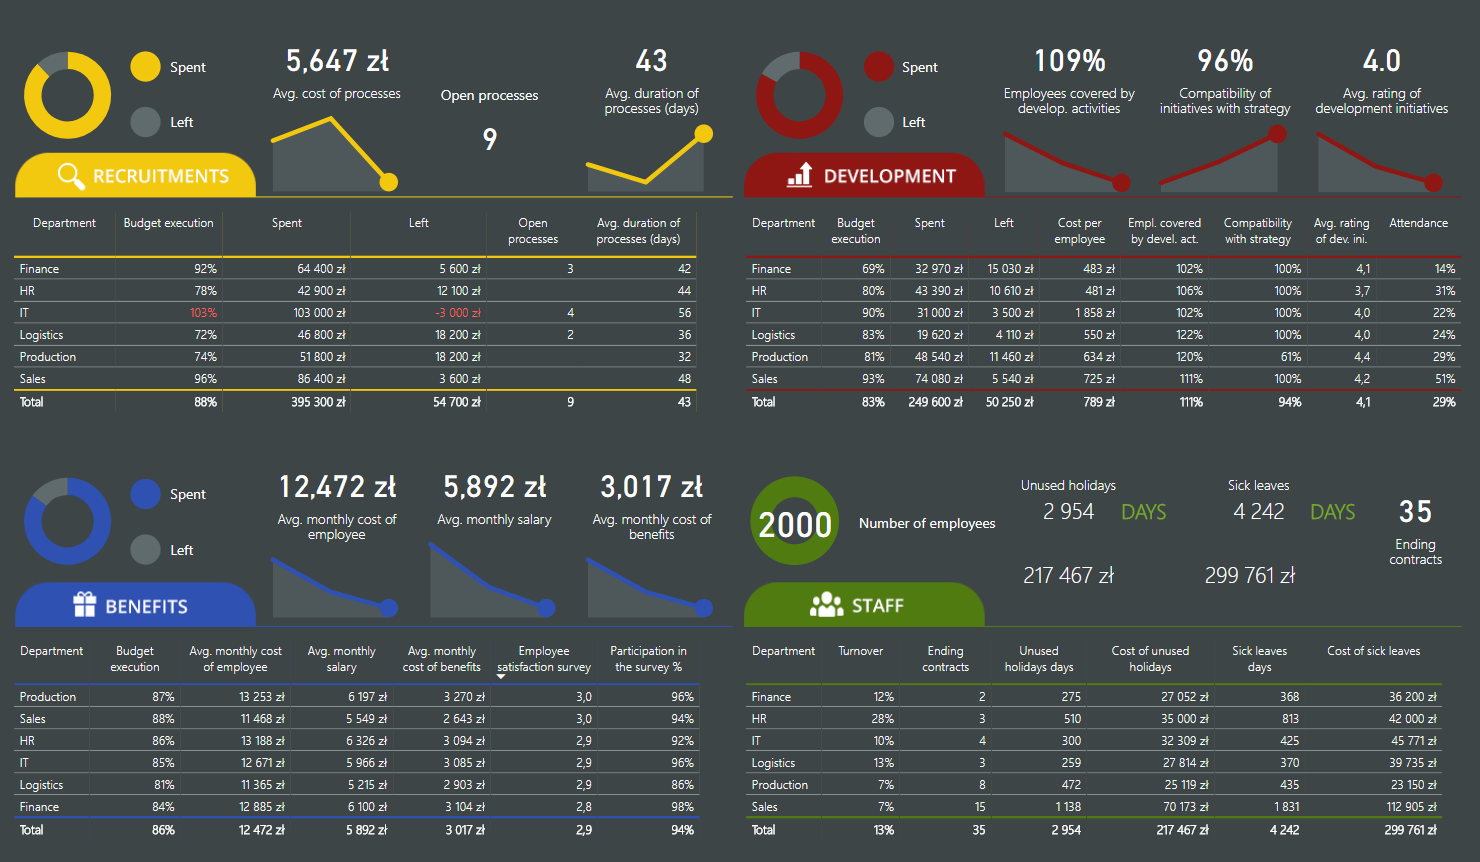
See below an example of such dashboard. The top-level view provides direct access to key data in each of the four key processes: Talent Sourcing/Recruitment, Talent Development, Employee Benefits and Employee Data management [aka ‘hard HR’]. Each of the areas is measured by 4 key metrics including typically both financial component like budget realization, or unit cost of recruitment, as well as key process metric like number of open recruitment processes, or adherence of training to established strategy of talent development. It also provides direct access from the main page to specific of data by department to observe differences and enable the Chief HR Officer to provide swift answer to his leadership team colleague like the CMO about development costs of their employees and how do they compare to employees in sales, or how the attrition and days of sick leave balance trend for his organization. Having all these data effectively visualized on one page. Always updated allows totally different level of conversation within the HR department and when HR leader needs to defend their strategy in front of the CEO or the leadership team peers.
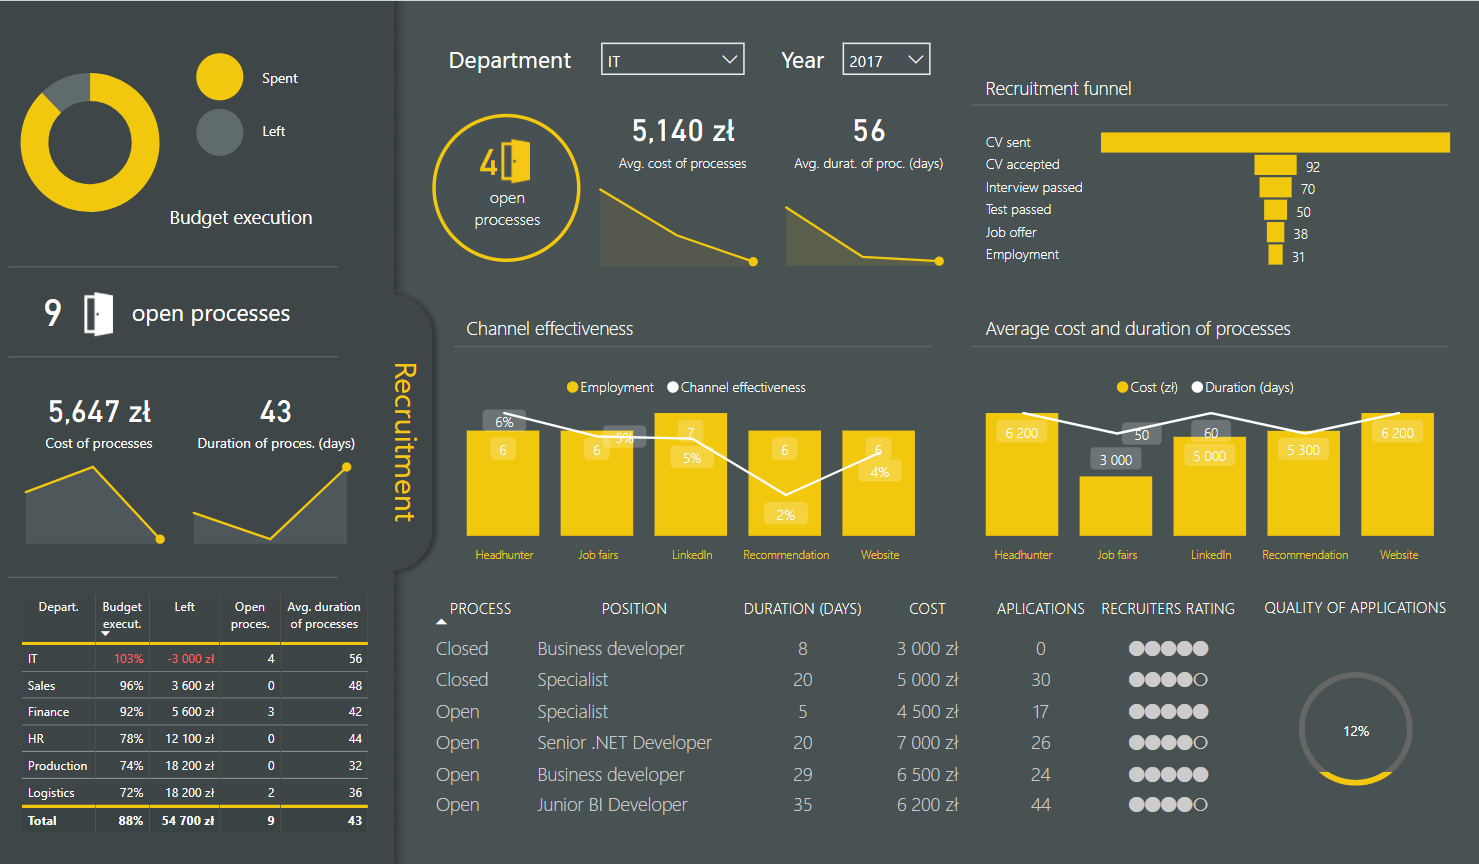
In case such conversation requires takes deeper analysis, detailed data on each of the areas is available in a report with just one quick click below. The recruiting report provides ability to see current status of each opening and answer questions about the recruitment funnel: the number of applicants and interviews already completed. Smarter decisions may be taken by looking at costs of hiring for each of the positions and how much of these costs are attributed to each of the ‘attraction’ channels. Shall we continue to expand investments in recruitment on social networks, portals or maybe more traditional employee references. These decisions can now be data based and taken through the angle of not only costs, but also time to recruit and quality of the applicants. But this is only a start and we can become much smarter than that. Organizing recruitment process data in such a way and generating good records of each recruitment process becomes an excellent training data for machine learning models that can make future recruitment much more powerful. For example, when linked with the data on performance reviews of hired employees a machine learning model could predict likelihood of an applicant becoming a top performer, or leaving the company in a year or less. Models can also easily scan social network history of each applicants and help hiring mangers assess compatibility of the employee with company values. Having such predictions can drastically lower the amount of costly hiring mistakes.
In my practice the area of employee trainings and development also often becomes a source of heated debates. Detailed dashboard on development budgets, investment per employee, coverage of employees that had a development activity this year as well as average score and participation in trainings are powerful metrics to understand the health of the process. Selecting any of the departments shows values for this metric for each of the functions. We can analyze investments by type of an initiative, but even more importantly, see how much budget and time is spent on initiatives that are in line with the agreed talent development strategy. Automated anomaly detection on this report can warn us and our talent development director about anomalies. Abnormally high spent on a specific medium or initiative, or a department that has highly underutilized training budget.

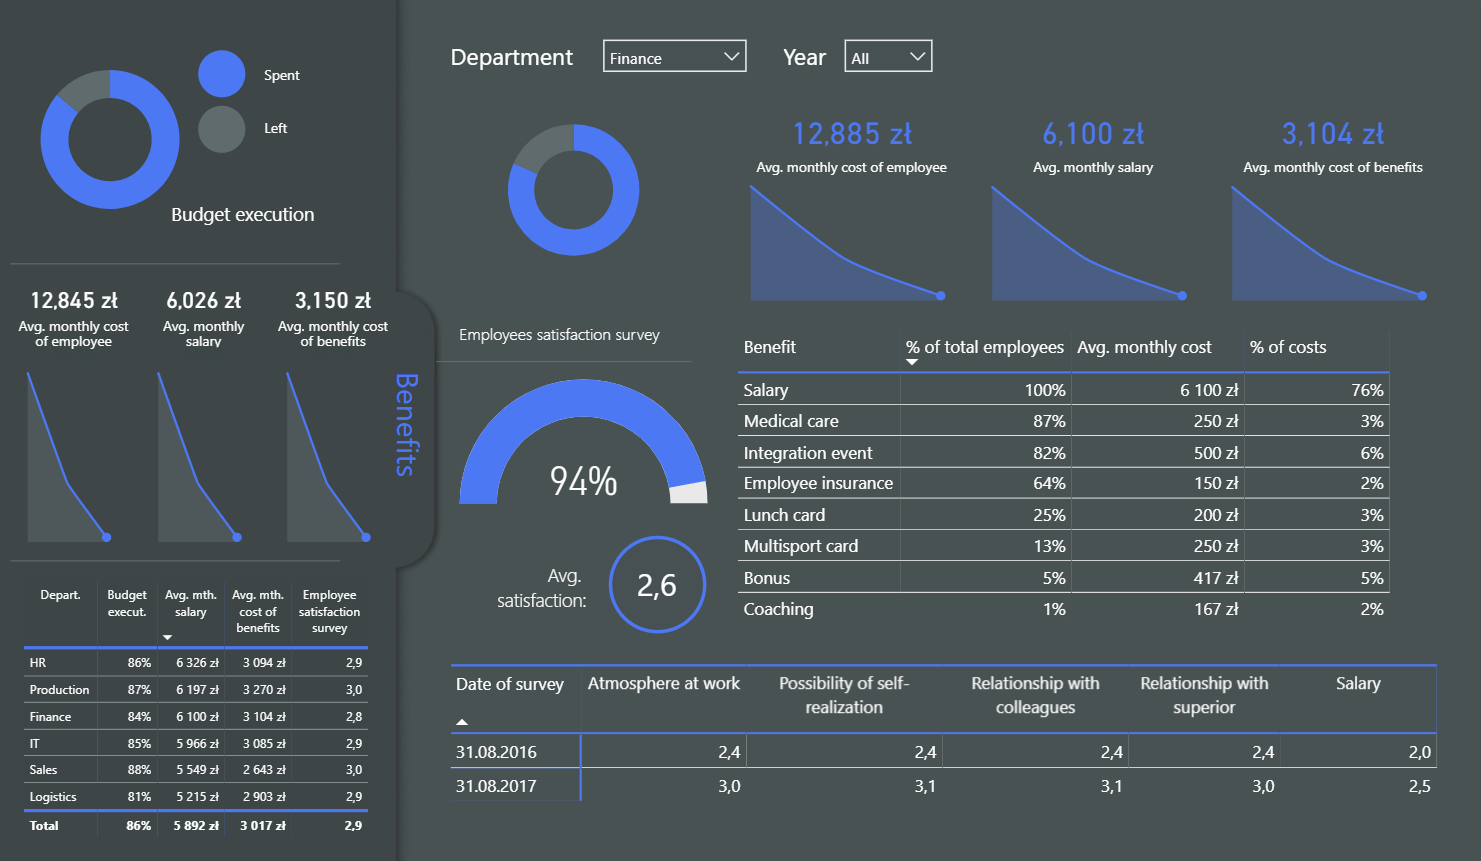
In the growing war for top talent companies invest in diverse range of benefits which next to salary include all forms of life and medical insurance, access to sport facilities, cultural events or largely subsidized cafeterias. Due to differing life-styles and quickly shifting job markets, the effectiveness of various benefits is variable and aggregated data helps reason around the effectiveness of each of them and take swift decisions. Data based clarity on employee costs, participation and satisfaction from each benefit per department allows to take away emotions from this conversation and drive data based decisions on optimizing the investments and preventing loss of precious talent. Also in this space advanced analytics can help monitor and inform about anomalies and shifts in costs and satisfaction. When this data is linked with employee performance data and predictions on employee retention, many of the benefit and salary management decisions could be automated. For example a machine learning model can now monitor the job market situation being fed data from linked-in, consume benefit utilization information as well as recent training history and trigger an alert to manager and HR when likelihood of one of our top talents to leave is higher prompting an adjustment in salary or level. It is still HR and manager that is in charge of decision, but would it harm if we had AI agent warn us ahead of time?
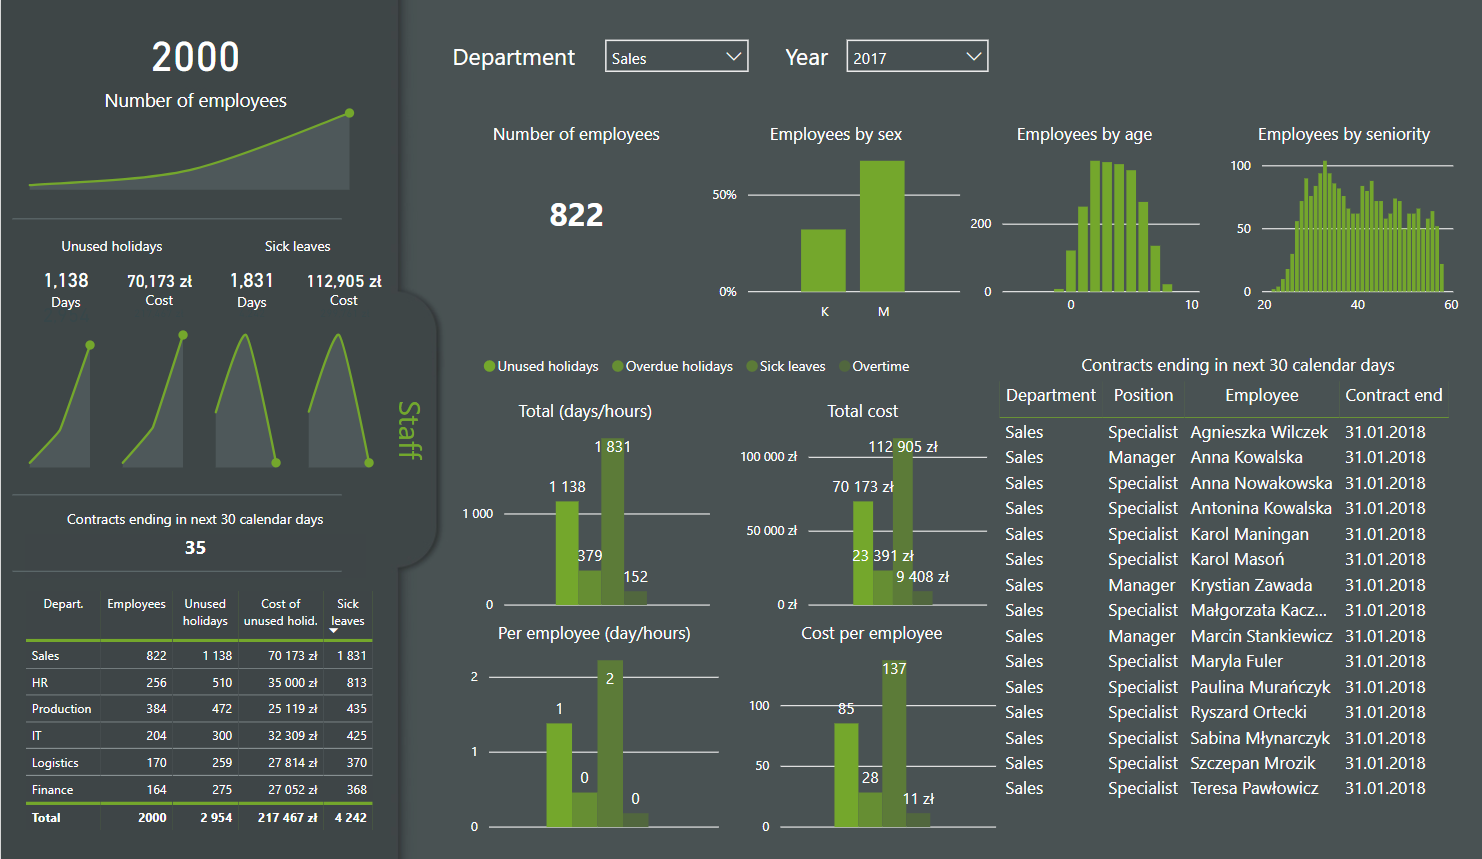
Finally, we still need to make sure that our base HR processes run and we stay in line with the legal requirements, with each employee working based on a valid contract, work visa or health certificate. All these processes are prime for automation, because nothing stops us now from having all contracts automatically stored in an IT system, which will send renewal notice to the employee on a given time. Similarly, the vacation and sick leave entitlements already now are often reported by and managed by automated systems. Still the HR leader has a legal responsibility to monitor them and ensure the company operates in line with the employment laws. As we know from our practice quite often employees and their managers fall behind on these processes and it is the role of HR to gently nudge them to perform the necessary tasks on time.
Having all data in one place, and effective alerting when some of the process fall behind can largely reduce efforts in this space and allow us to sleep better at night.
Additional benefit of organizing data in this space is that these base facts on employees, their contract extension dates or amounts of vacations and sick leaves can be very important signals for the machine learning models predicting employee retention, satisfaction or performance.
Organizing employee data is this first essential first step in digital transformation or HR function, and doing so will unlock innovation and use of AI in workforce management. It is also an essential step to re-train HR professionals and prepare us all for the next 10 years of digital disruption.